RSS

July 2017 Media Stats Package
Info-July-2017-portal

Metro Vancouver sees fewer home sales and more listings in July

Home buyer activity returned to more typical summer levels in Metro Vancouver* last month.

The Real Estate Board of Greater Vancouver (REBGV) reports that residential property sales in the region totalled 2,960 in July 2017, an 8.2 per cent decrease from the 3,226 sales recorded in July 2016, and a decrease of 24 per cent compared to June 2017 when 3,893 homes sold.

Last month’s sales were 0.7 per cent above the 10-year July sales average.

“Housing demand is inconsistent across the region right now. Pockets of the market are still receiving multiple offers and others are not. It depends on price, property type, and location,” Jill Oudil, REBGV president said. “For example, it’s taking twice as long, on average, for a detached home to sell compared to both townhomes and condominiums.”

There were 5,256 detached, attached and apartment properties newly listed for sale on the Multiple Listing Service® (MLS®) in Metro Vancouver in July 2017. This represents a 0.3 per cent increase compared to the 5,241 homes listed in July 2016 and an 8.1 per cent decrease compared to June 2017 when 5,721 homes were listed.

The total number of properties currently listed for sale on the MLS® system in Metro Vancouver is 9,194, a 10.1 per cent increase compared to July 2016 (8,351) and an eight per cent increase compared to June 2017 (8,515).

“Because home sale activity decreased to more historically normal levels in July, the selection of homes for sale in the region was able to edge above 9,000 for the first time this year,” Oudil, said.

For all property types, the sales-to-active listings ratio for July 2017 is 32.2 per cent. By property type, the ratio is 16.9 per cent for detached homes, 44.9 per cent for townhomes, and 62 per cent for condominiums.

Generally, analysts say that downward pressure on home prices occurs when the ratio dips below the 12 per cent mark for a sustained period, while home prices often experience upward pressure when it surpasses 20 per cent over several months.

The MLS® Home Price Index composite benchmark price for all residential properties in Metro Vancouver is currently $1,019,400. This represents an 8.7 per cent increase over July 2016 and a 2.1 per cent increase compared to June 2017.

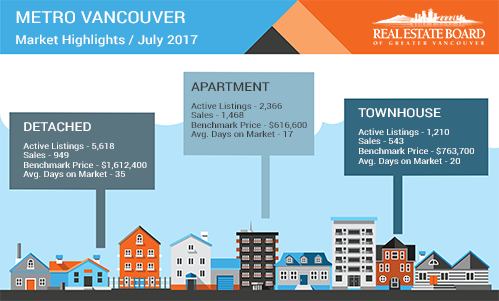
Sales of detached properties in July 2017 reached 949, a decrease of 11.9 per cent from the 1,077 detached sales recorded in July 2016. The benchmark price for detached properties is $1,612,400. This represents a 1.9 per cent increase from July 2016 and a 1.5 per cent increase compared to June 2017.

Sales of apartment properties reached 1,468 in July 2017, a decrease of 8.4 per cent compared to the 1,602 sales in July 2016. The benchmark price of an apartment property is $616,600. This represents an 18.5 per cent increase from July 2016 and a 2.7 per cent increase compared to June 2017.

Attached property sales in July 2017 totalled 543, a decrease of 0.7 per cent compared to the 547 sales in July 2016. The benchmark price of an attached unit is $763,700. This represents an 11.9 per cent increase from July 2016 and a 2.4 per cent increase compared to June 2017.      

*Editor’s Note

Areas covered by the Real Estate Board of Greater Vancouver include: Whistler, Sunshine Coast, Squamish, West Vancouver, North Vancouver, Vancouver, Burnaby, New Westminster, Richmond, Port Moody, Port Coquitlam, Coquitlam, Pitt Meadows, Maple Ridge, and South Delta.

The real estate industry is a key economic driver in British Columbia. In 2016, 39,943 homes changed ownership in the Board’s area, generating $2.5 billion in economic spin-off activity and an estimated 17,600 jobs. The total dollar value of residential sales transacted through the MLS® system in Greater Vancouver totalled $40 billion in 2016.

Read

Info-June-2017-portal

Demand for condominiums continues to outstrip supply

The imbalance between supply and demand in the condominium market is creating home buyer competition across Metro Vancouver*.

The Real Estate Board of Greater Vancouver (REBGV) reports that residential property sales in the region totalled 3,893 in June 2017, an 11.5 per cent decrease from the 4,400 sales recorded in June 2016, an all-time record, and a decrease of 10.8 per cent compared to May 2017 when 4,364 homes sold.

Last month’s sales were 14.5 per cent above the 10-year June sales average.

“Two distinct markets have emerged this summer. The detached home market has seen demand ease back to more typical levels while competition for condominiums is creating multiple offer scenarios and putting upward pressure on prices for that property type,” Jill Oudil, REBGV president said.

There were 5,721 detached, attached and apartment properties newly listed for sale on the Multiple Listing Service® (MLS®) in Metro Vancouver in June 2017. This represents a 2.6 per cent decrease compared to the 5,875 homes listed in June 2016 and a 5.3 per cent decrease compared to May 2017 when 6,044 homes were listed.

The total number of properties currently listed for sale on the MLS® system in Metro Vancouver is 8,515, a nine per cent increase compared to June 2016 (7,812) and a 4.2 per cent increase compared to May 2017 (8,168).

“Home buyers have more selection to choose from in the detached market today while condominium listings are near an all-time low on the MLS®,” Oudil said. “Detached home listings have increased every month this year, while the number of condominiums for sale has decreased each month since February.”

For all property types, the sales-to-active listings ratio for June 2017 is 45.7 per cent. By property type, the ratio is 24.5 per cent for detached homes, 62 per cent for townhomes, and 93.2 per cent for condominiums.

Generally, analysts say that downward pressure on home prices occurs when the ratio dips below the 12 per cent mark for a sustained period, while home prices often experience upward pressure when it surpasses 20 per cent over several months.

“Market conditions will vary today depending on area and property type,” Oudil said. “It’s important to work with your local REALTOR® to help you understand the trends that are occurring in your community.”

The MLS® Home Price Index composite benchmark price for all residential properties in Metro Vancouver is currently $998,700. This represents a 7.9 per cent increase over June 2016 and a 1.8 per cent increase compared to May 2017.

Sales of detached properties in June 2017 reached 1,320, a decrease of 15.5 per cent from the 1,562 detached sales recorded in June 2016. The benchmark price for detached properties is $1,587,900. This represents a 1.4 per cent increase from June 2016 and a 1.1 per cent increase compared to May 2017.

Sales of apartment properties reached 1,905 in June 2017, a decrease of 9.6 per cent compared to the 2,108 sales in June 2016. The benchmark price of an apartment property is $600,700. This represents a 17.6 per cent increase from June 2016 and a 2.9 per cent increase compared to May 2017.

Attached property sales in June 2017 totalled 668, a decrease of 8.5 per cent compared to the 730 sales in June 2016. The benchmark price of an attached unit is $745,700. This represents a 10.7 per cent increase from June 2016 and a 0.6 per cent increase compared to May 2017.

*Editor’s Note

Areas covered by the Real Estate Board of Greater Vancouver include: Whistler, Sunshine Coast, Squamish, West Vancouver, North Vancouver, Vancouver, Burnaby, New Westminster, Richmond, Port Moody, Port Coquitlam, Coquitlam, Pitt Meadows, Maple Ridge, and South Delta.

The real estate industry is a key economic driver in British Columbia. In 2016, 39,943 homes changed ownership in the Board’s area, generating $2.5 billion in economic spin-off activity and an estimated 17,600 jobs. The total dollar value of residential sales transacted through the MLS® system in Greater Vancouver totalled $40 billion in 2016.

Read

May 2017 Media Stats Package

Info-May-2017-portal

Home buyer activity returned to near record levels across the Metro Vancouver* housing market in May. 

Residential property sales in the region totalled 4,364 in May 2017, a decrease of 8.5 per cent from the 4,769 sales in May 2016, an all-time record, and an increase of 22.8 per cent compared to April 2017 when 3,553 homes sold.

Last month’s sales were 23.7 per cent above the 10-year May sales average and is the thirdhighest selling May on record.

"Demand for condominiums and townhomes is driving today’s activity," Jill Oudil, Real Estate Board of Greater Vancouver (REBGV) president said. “First-time buyers and people looking to downsize from their single-family homes are both competing for these two types of housing.”

New listings for detached, attached and apartment properties in Metro Vancouver totalled 6,044 in May 2017. This represents a 3.9 per cent decrease compared to the 6,289 units listed in May 2016 and a 23.2 per cent increase compared to April 2017 when 4,907 homes were listed.

The month-over-month increase in new listings was led by detached homes at 27.1 per cent, followed by apartments at 22.7 per cent and townhomes at 14.1 per cent.

The total number of properties currently listed for sale on the MLS® system in Metro Vancouver is 8,168, a 5.7 per cent increase compared to May 2016 (7,726) and a 4.5 per cent increase compared to April 2017 (7,813).

"Home buyers are beginning to have more selection to choose from in the detached market, but the number of condominiums for sale continues to decline," Oudil said.

The sales-to-active listings ratio across all residential categories is 53.4 per cent. By property type, the ratio is 31 per cent for detached homes, 76.1 per cent for townhomes, and 94.6 per cent for condominiums.

Generally, analysts say that downward pressure on home prices occurs when the ratio dips below the 12 per cent mark for a sustained period, while home prices often experience upward pressure when it surpasses 20 per cent over several months.

“While sales are inching closer to the record-breaking pace of 2016, the market itself looks different. Sales last year were driven by demand for single-family homes. This year, it's clear that townhomes and condominiums are leading the way,” said Oudil. “It’s important to work with your local REALTOR® to understand the different factors affecting the market today.”

The MLS® Home Price Index composite benchmark price for all residential properties in Metro Vancouver is currently $967,500. This represents an 8.8 per cent increase over May 2016 and a 2.8 per cent increase compared to April 2017.

Sales of detached properties in May 2017 reached 1,548, a decrease of 17 per cent from the 1,865 detached sales recorded in May 2016. The benchmark price for a detached property is $1,561,000. This represents a 3.1 per cent increase over May 2016 and a 2.9 per cent increase compared to April 2017.

Sales of apartment properties reached 2,025 in May 2017, a decrease of 5.8 per cent compared to the 2,150 sales in May 2016.The benchmark price for an apartment property is $571,300. This represents a 17.8 per cent increase over May 2016 and a 3.1 per cent increase compared to April 2017.

Attached property sales in May 2017 totalled 791, an increase of 4.9 per cent compared to the 754 sales in May 2016. The benchmark price for an attached property is $715,400. This represents a 13.1 per cent increase over May 2016 and a 1.9 per cent increase compared to April 2017.


*Editor’s Note: Areas covered by the Real Estate Board of Greater Vancouver include: Whistler, Sunshine Coast, Squamish, West Vancouver, North Vancouver, Vancouver, Burnaby, New Westminster, Richmond, Port Moody, Port Coquitlam, Coquitlam, Pitt Meadows, Maple Ridge, and South Delta.

The real estate industry is a key economic driver in British Columbia. In 2016, 39,943 homes changed ownership in the Board’s area, generating $2.5 billion in economic spin-off activity and an estimated 17,600 jobs. The total dollar value of residential sales transacted through the MLS® system in Greater Vancouver totalled $40 billion in 2016.
Read

Condominiums and townhomes in high demand across Metro Vancouver

Demand for condominiums and townhomes continues to drive the Metro Vancouver* housing market.

Residential property sales in the region totalled 3,553 in April 2017, a 25.7 per cent decline compared to April 2016 when 4,781 homes sold and a 0.7 per cent decrease from the 3,579 sales recorded in March 2017.

April sales were 4.8 per cent above the 10-year average for the month.

For the first four months of the year, condominium and townhome sales have comprised a larger percentage of all residential sales on the Multiple Listing Service® (MLS®) in Metro Vancouver. Over this time, they’ve accounted for 68.5 per cent, on average, of all residential sales. This is up 10 per cent from the 58.2 per cent average over the same period last year.

“Our overall market is operating below the record-setting pace from a year ago and is in line with historical spring levels. It’s a different story in our condominium and townhome markets," Jill Oudil, Real Estate Board of Greater Vancouver (REBGV) president said. “Demand has been increasing for months and supply is not keeping pace. This dynamic is causing prices to increase and making multiple offer scenarios the norm.”

New listings for detached, attached and apartment properties in Metro Vancouver totalled 4,907 in April 2017. This represents a decrease of 19.9 per cent compared to the 6,127 units listed in April 2016 and a three per cent increase compared to March 2017 when 4,762 properties were listed.

The total number of residential properties currently listed for sale on the MLS® system in Metro Vancouver is 7,813, a 3.5 per cent increase compared to April 2016 (7,550) and a three per cent increase compared to March 2017 (7,586).

The sales-to-active listings ratio for April 2017 is 45.5 per cent for all property types. This is two per cent below March 2017 and is indicative of a sellers’ market. Generally, analysts say that downward pressure on home prices occurs when the ratio dips below the 12 per cent mark for a sustained period, while home prices often experience upward pressure when it surpasses 20 per cent over several months.

By property type, the sales-to-active listings ratio is 26 per cent for detached homes, 58.2 per cent for townhomes, and 82.2 per cent for condominiums.

“Until more entry level, or ‘missing middle’, homes are available for sale in our market, we’ll likely continue to see prices increase,” Oudil said. “There’s been record building this past year, but much of that inventory isn’t ready to hit the market.”

The MLS® Home Price Index composite benchmark price for all residential properties in Metro Vancouver is currently $941,100. This represents a five per cent increase over the past three months and an 11.4 per cent increase compared to April 2016.

Over the last three months, the benchmark price of condominiums has seen the largest increase in the region at 8.2 per cent, followed by townhomes at 5.3 per cent, and detached homes at 2.8 per cent.

“Home buyers are looking to get into the market and they’re facing fierce competition,” Oudil said. “It’s important to work with your local Realtor to help you navigate today’s marketplace.”

Sales of detached properties in April 2017 reached 1,211, a decrease of 38.8 per cent from the 1,979 detached sales recorded in April 2016. The benchmark price for detached properties is $1,516,500. This represents an 8.1 per cent increase over the last 12 months and a 1.8 per cent increase compared to March 2017.

Sales of apartment, or condominium, properties reached 1,722 in April 2017, a decrease of 18.3 per cent compared to the 2,107 sales in April 2016.The benchmark price of an apartment property is $554,100. This represents a 16.6 per cent increase over the past 12 months and a 3.1 per cent increase compared to March 2017.

Attached, or townhome, property sales in April 2017 totalled 620, a decrease of 10.8 per cent compared to the 695 sales in April 2016. The benchmark price of an attached unit is $701,800. This represents a 15.3 per cent increase over the past 12 months and a 2.4 per cent increase compared to March 2017.

Read

Info-March-2017


Demand for homes continues to outpace supply in Metro Vancouver

Residential property sales in the region totalled 3,579 in March 2017, a decrease of 30.8 per cent from the 5,173 sales recorded in record-breaking March 2016 and an increase of 47.6 per cent compared to February 2017 when 2,425 homes sold.

Last month’s sales were 7.9 per cent above the 10-year sales average for the month.

“While demand in March was below the record high of last year, we saw demand increase month-to-month for condos and townhomes,” Jill Oudil, Real Estate Board of Greater Vancouver (REBGV) president said. “Sellers still seem reluctant to put their homes on the market, making for stiff competition among home buyers.”

New listings for detached, attached and apartment properties in Metro Vancouver totalled 4,762 in March 2017. This represents a decrease of 24.1 per cent compared to the 6,278 units listed in March 2016 and a 29.9 per cent increase compared to February 2017 when 3,666 properties were listed.

This is the lowest number of new listings in March since 2009.

The total number of properties currently listed for sale on the MLS® system in Metro Vancouver is 7,586, a 3.1 per cent increase compared to March 2016 (7,358) and a 0.1 per cent decrease compared to February 2017 (7,594).

The sales-to-active listings ratio for March 2017 is 47.2 per cent, a 15-point increase over February. Generally, analysts say that downward pressure on home prices occurs when the ratio dips below the 12 per cent mark for a sustained period, while home prices often experience upward pressure when it surpasses 20 per cent over several months.

“Home prices will likely continue to increase until we see more housing supply coming on to the market,” Oudil said.

The MLS® Home Price Index composite benchmark price for all residential properties in Metro Vancouver is currently $919,300. This represents a 0.8 per cent decrease over the past six months and a 1.4 per cent increase compared to February 2017.

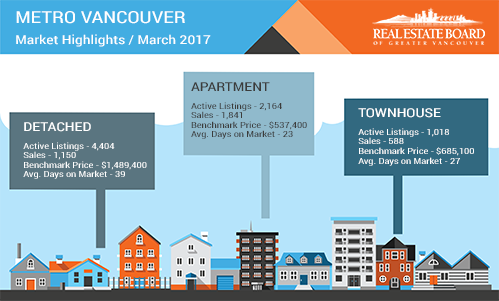
Sales of detached properties in March 2017 reached 1,150, a decrease of 46.1 per cent from the 2,135 detached sales recorded in March 2016. The benchmark price for detached properties is $1,489,400. This represents a 5.0 per cent decrease over the past six months and a one per cent increase compared to February 2017.

Sales of apartment properties reached 1,841 in March 2017, a decrease of 18.3 per cent compared to the 2,252 sales in March 2016.The benchmark price of an apartment property is $537,400. This represents a 5.2 per cent increase over the past six months and a 2.1 per cent increase compared to February 2017.

Attached property sales in March 2017 totalled 588, a decrease of 25.2 per cent compared to the 786 sales in March 2016. The benchmark price of an attached unit is $685,100. This represents a 1.3 per cent increase over the past six months and a 1.4 per cent increase compared to February 2017.

Read

Info-Feb-2017-portal


Low supply continues to limit Metro Vancouver home buyers

Reluctance amongst Metro Vancouver* home sellers is impacting sale and price activity throughout the region’s housing market.

Residential home sales in the region totalled 2,425 in February 2017. This is a 41.9 per cent decrease from the record 4,172 homes sold in February 2016 and an increase of 59.2 per cent compared to January 2017 when 1,523 homes sold.

Last month’s sales were 7.7 per cent below the 10-year February sales average.

“February home sales were well below the record-breaking activity from one year ago and in line with our long-term historical average for the month,” Dan Morrison, Real Estate Board of Greater Vancouver (REBGV) president said. “Limited supply and snowy weather were two factors hampering this activity.”

New listings for detached, attached and apartment properties in Metro Vancouver totalled 3,666 in February 2017. This represents a 36.9 per cent decrease compared to the 5,812 units listed in February 2016 and an 11.4 per cent decrease compared to January 2017 when 4,140 properties were listed.

This is the lowest number of new listings registered in February since 2003.

The total number of properties currently listed for sale on the Multiple Listing Service® (MLS®) in Metro Vancouver is 7,594, a four per cent increase compared to February 2016 (7,299) and a 4.9 per cent increase compared to January 2017 (7,238).

The region’s sales-to-active listings ratio for February 2017 is 31.9 per cent, a 10-point increase from January. Generally, analysts say that downward pressure on home prices occurs when the ratio dips below the 12 per cent mark for a sustained period, while home prices often experience upward pressure when it surpasses 20 per cent over several months.

“While home sales are not happening at the pace we experienced last year, home seller supply is still struggling to keep up with today’s demand. This is why we’ve seen little downward pressure on home prices, particularly in the condominium and townhome markets,” Morrison said.

The MLS® Home Price Index composite benchmark price for all residential properties in Metro Vancouver is currently $906,700. This represents a 2.8 per cent decrease over the past six months and a 1.2 per cent increase compared to January 2017.

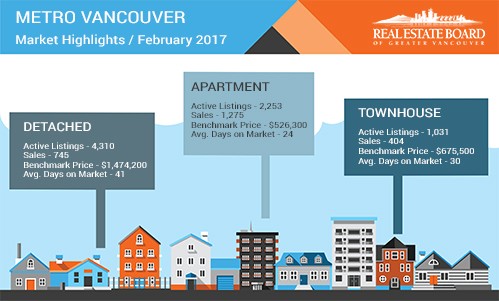
Sales of detached properties in February 2017 reached 745, a decrease of 58.1 per cent from the 1,778 detached sales recorded in February 2016. The benchmark price for detached properties is $1,474,200. This represents a 6.5 per cent decrease over the past six months and is unchanged compared to January 2017.

Sales of apartment properties reached 1,275 in February 2017, a decrease of 28.8 per cent compared to the 1,790 sales in February 2016.The benchmark price of an apartment property is $526,300. This represents a 2.3 per cent increase over the past six months and a 2.7 per cent increase compared to January 2017.

Attached property sales in February 2017 totalled 404, a decrease of 33.1 per cent compared to the 604 sales in February 2016. The benchmark price of an attached unit is $675,500. This represents a 0.3 per cent decrease over the past six months and a 1.3 per cent increase compared to January 2017.


Read